Mastering RSI

Sami Noori September 27, 2024 9:22 pm Tags
In today’s technical analysis session, we’re looking at the Relative Strength Index, or RSI for short.    Only 3 letters, but an indicator that can provide a book’s-worth of trading insights.   In this guide, we’ll break down the Relative Strength Index (RSI) and give you practical insights on how to use it to level up your trading.    By the end, you’ll be able to spot overbought or oversold conditions like a pro, helping you make smarter, more informed trading decisions.  

What is RSI?

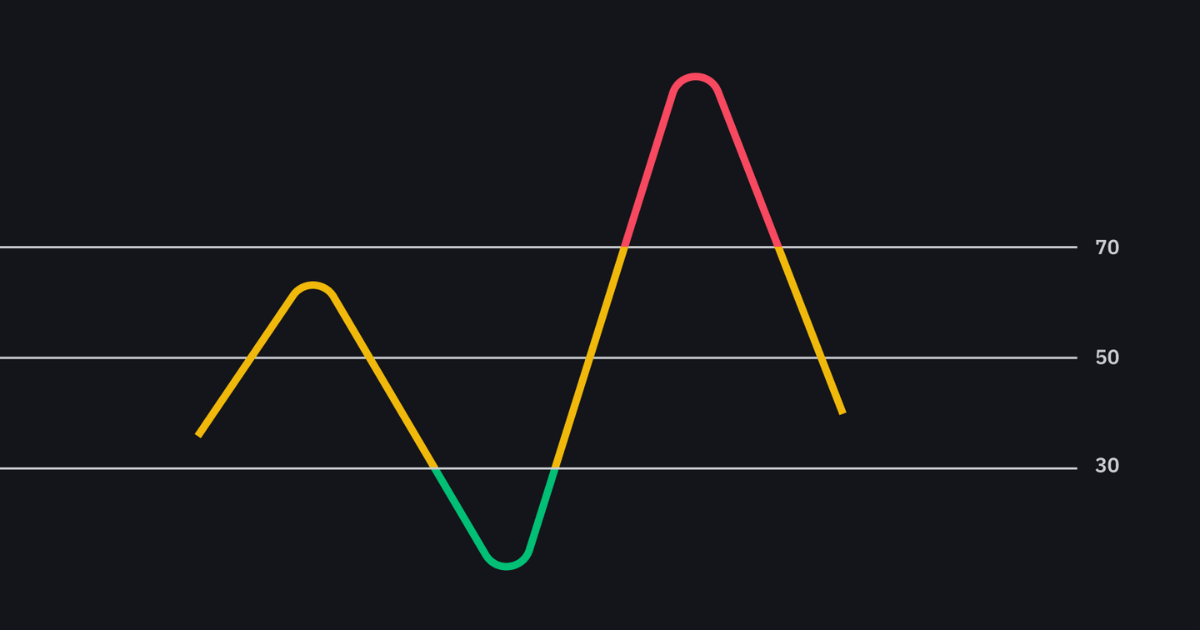
  The Relative Strength Index (RSI) is a momentum indicator that measures the speed and change of price movements.    Developed by J. Welles Wilder in the late 1970s, the RSI helps traders identify overbought or oversold conditions in an asset, which can signal potential reversals.    It ranges between 0 and 100, with values typically above 70 indicating overbought conditions and values below 30 suggesting the asset is oversold.   Put simply, RSI tells you when an instrument might be due for a correction.  

Golden rules of RSI

  Here are the key principles of RSI that every trader should know.  

Overbought and oversold levels

 
  • Above 70: The asset is considered overbought, suggesting that it could be due for a pullback or reversal.
 
  • Below 30: The asset is considered oversold, indicating that a potential rally or reversal could be on the horizon.
  Think of it as a signal to pay attention to, but don’t take action blindly. Always look for additional confirmation.  

Divergences

  Divergences occur when the price of an asset moves in the opposite direction to the RSI. This can be a powerful signal of a potential reversal.   Bullish Divergence: The price is making lower lows while the RSI is making higher lows. This indicates a potential bullish reversal.   Bearish Divergence: The price is making higher highs while the RSI is making lower highs. This signals a possible bearish reversal.  

Midline (50) cross

  The midline, which is 50 on the RSI, can serve as a trend confirmation point:   Above 50: Generally indicates an uptrend.   Below 50: Suggests a downtrend.  

How to use RSI in your trading strategy

  Let’s get practical. Here’s how you can incorporate RSI into your trading strategy.  
  1. Combine RSI with other indicators: RSI works best when used in conjunction with other technical indicators, such as Moving Averages, Bollinger Bands, or MACD. By using multiple indicators, you can confirm signals and filter out false ones.
  For example, if the RSI shows overbought conditions and a moving average crossover occurs, it could be a strong sign that the price is about to reverse.  
  1. Use RSI to confirm trends: RSI can be an excellent tool for confirming whether an asset is in a strong trend. In an uptrend, RSI typically stays between 40 and 80, while in a downtrend, it usually fluctuates between 20 and 60. 
  When RSI stays in the upper range of these levels, it confirms the strength of the trend.  
  1. Spotting reversals: One of the RSI’s main strengths is its ability to identify potential reversals. When the RSI moves into overbought or oversold territory, it often signals that the current trend is losing steam and may reverse.
  But remember: RSI can stay overbought or oversold for extended periods in a strong trend. Look for divergences or crossovers around the 50-level to confirm potential reversals.  

Common trading mistakes using RSI

  While RSI is an incredibly useful trading tool, many traders fall into the trap of relying solely on RSI to make their trading decisions.    This can lead to poor outcomes, as RSI alone may not provide the full picture. It’s essential to combine RSI with other technical tools or chart patterns to get a more comprehensive understanding of market conditions.    Indicators such as moving averages, MACD, or even price action analysis can help confirm the signals provided by RSI, making your trading decisions more robust and informed.   Another common mistake is not considering the time frame. RSI readings can vary significantly depending on whether you’re looking at a daily, hourly, or minute chart   An asset might appear overbought on a daily chart but show completely different conditions on a shorter timeframe. Therefore, it’s crucial to assess multiple timeframes before making any decisions. This ensures that you have a more complete view of the market’s movements and prevents you from acting on misleading signals.   Traders often ignore market conditions, forgetting that RSI is most effective in range-bound markets. During strong trending markets, RSI can remain overbought or oversold for extended periods, which can lead to false signals.   In these cases, instead of using RSI as a primary decision-making tool, it’s better to use it as a trend confirmation tool. This allows you to filter out noise and focus on the larger market context, reducing the risk of making trades based on misleading signals.  

Advanced RSI strategies

  Once you’re comfortable with the basics, you can move on to more advanced RSI strategies to enhance your trading.  

RSI swing rejections

  An RSI swing rejection occurs when RSI enters overbought or oversold territory, reverses direction slightly, and then bounces back into the original territory, signaling the continuation of the existing trend.   For example, in an uptrend, if RSI reaches the 30 level (oversold), bounces slightly above it, and then falls back to 30, it could signal the continuation of the downtrend.  

RSI trendlines

  Just like price charts, you can draw trendlines on the RSI. Breaking a trendline on the RSI can often precede a price breakout or breakdown, giving you an early indication of a change in trend.  

Final thoughts

  Mastering RSI is about more than just spotting overbought or oversold conditions.    It’s about understanding how to use the indicator to confirm trends, spot divergences, and filter false signals. When used correctly, RSI can become one of the most valuable tools in your trading arsenal.   Remember, like any tool, RSI works best when used in combination with other indicators and within a broader strategy. Whether you’re a forex, stock, or crypto trader, understanding RSI can give you a clear edge in the market.    Stay disciplined, keep practicing, and you’ll find RSI to be a reliable partner in your trading journey.

Sign up to get the inside scoop on today’s biggest stories in markets, finance, and business.

By clicking “Sign Up”, you accept our Terms of Service and Privacy Policy. You can opt-out at any time by visiting our Preferences page or by clicking "unsubscribe" at the bottom of the email.