


Candlestick patterns are a visual representation of price movements over a specific time period, showing the opening, closing, high, and low prices.
Each candlestick tells a story about market sentiment. Did buyers push prices higher or did sellers drive prices down? Understanding these patterns helps you anticipate future price action.
For UAE/GCC traders, candlestick patterns can offer a snapshot of market behavior, helping you make smarter decisions when trading local or global assets like oil, gold, or currencies.
Each candlestick has two main parts: the body and the wicks (or shadows). The body represents the difference between the opening and closing prices, while the wicks show the highest and lowest prices during the time period.
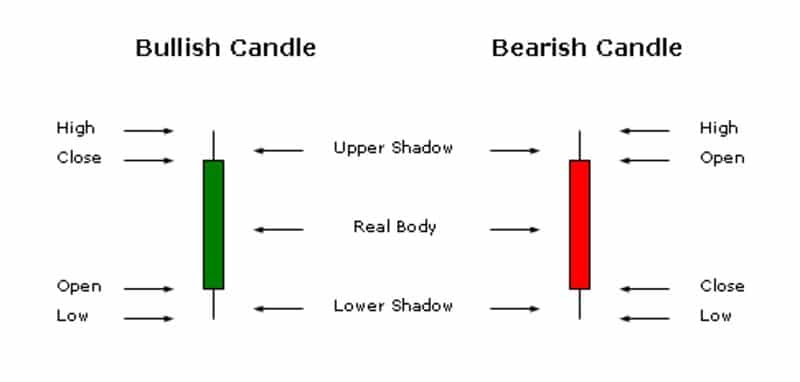
A green (or white) candlestick typically means the price closed higher than it opened, indicating a bullish sentiment.
A red (or black) candlestick means the price closed lower than it opened, signaling bearish sentiment.
This basic structure allows you to quickly assess whether buyers or sellers are in control.
The Doji
The Doji is a simple candlestick pattern that signals indecision in the market. When the opening and closing prices are nearly identical, it forms a cross-like shape. This pattern is most powerful when it appears at the end of a long uptrend or downtrend, suggesting a potential reversal.
The Hammer
This pattern looks like a hammer and signals a bullish reversal after a downtrend. It has a small body and a long lower wick, showing that while sellers initially pushed the price lower, buyers regained control and pushed it back up. Spotting a hammer at the bottom of a downtrend could indicate that the market is about to rise.
The Shooting Star
A Shooting Star is a bearish reversal pattern that occurs after an uptrend. It has a small body and a long upper wick, showing that buyers drove the price up, but sellers regained control and forced the price lower. It signals that the uptrend may be losing steam.
Bullish and Bearish Engulfing Patterns
A Bullish Engulfing occurs when a small bearish candlestick is followed by a larger bullish candlestick that completely engulfs it. This signals a strong reversal and often marks the beginning of an uptrend.
A Bearish Engulfing pattern is the opposite—a small bullish candle followed by a larger bearish candle. This signals a potential reversal in a downtrend.
While these patterns provide powerful insights into market sentiment, it’s important to use them as part of a broader trading strategy.
Candlestick patterns are most effective when combined with other indicators like moving averages or RSI (Relative Strength Index). For instance, if you spot a hammer and RSI shows the asset is oversold, it might be a good time to enter a buy position.
Always consider support and resistance levels. Candlestick patterns at key price levels can confirm the strength of the signal. For example, if a Bullish Engulfing pattern forms at a strong support level, it reinforces the likelihood of a trend reversal.
Many traders make the mistake of relying too heavily on candlestick patterns without considering the broader market context. Candlestick patterns alone won’t guarantee profitable trades—they need to be supported by other forms of technical analysis.
Another common mistake is using patterns without considering the time frame. Candlesticks can tell different stories on different timeframes. For example, what looks like a clear Doji on a 5-minute chart might be insignificant noise on a daily chart. It’s essential to view patterns across multiple timeframes for a clearer picture.
Finally, traders often ignore market conditions. Candlestick patterns work best in range-bound or sideways markets but can be misleading during strong trends.
For example, in a strong uptrend, an overbought signal from a Shooting Star may not result in an immediate reversal. Always pay attention to the broader market environment.
If you’re serious about mastering candlestick patterns, practice is key. Many brokers offer demo accounts where you can test your knowledge without risking real money.
Look at historical data and try to identify patterns in different market conditions. The more you practice, the more familiar you’ll become with spotting patterns in real time.
Mastering candlestick patterns is a valuable skill for any trader. By understanding the psychology behind each pattern, you can better anticipate market movements and make better informed trading decisions.
For local traders, candlestick patterns are especially useful for navigating both global markets and local assets like oil and currencies.
Remember, candlestick patterns are not a stand-alone solution. They are most powerful when used alongside other indicators and strategies.


Read Next
Sign up to get the inside scoop on today’s biggest stories in markets, finance, and business.
By clicking “Sign Up”, you accept our Terms of Service and Privacy Policy. You can opt-out at any time by visiting our Preferences page or by clicking "unsubscribe" at the bottom of the email.

Leave a Reply